
You have heard that people are leaving larger markets and moving to Arkansas, but do the numbers back it up?
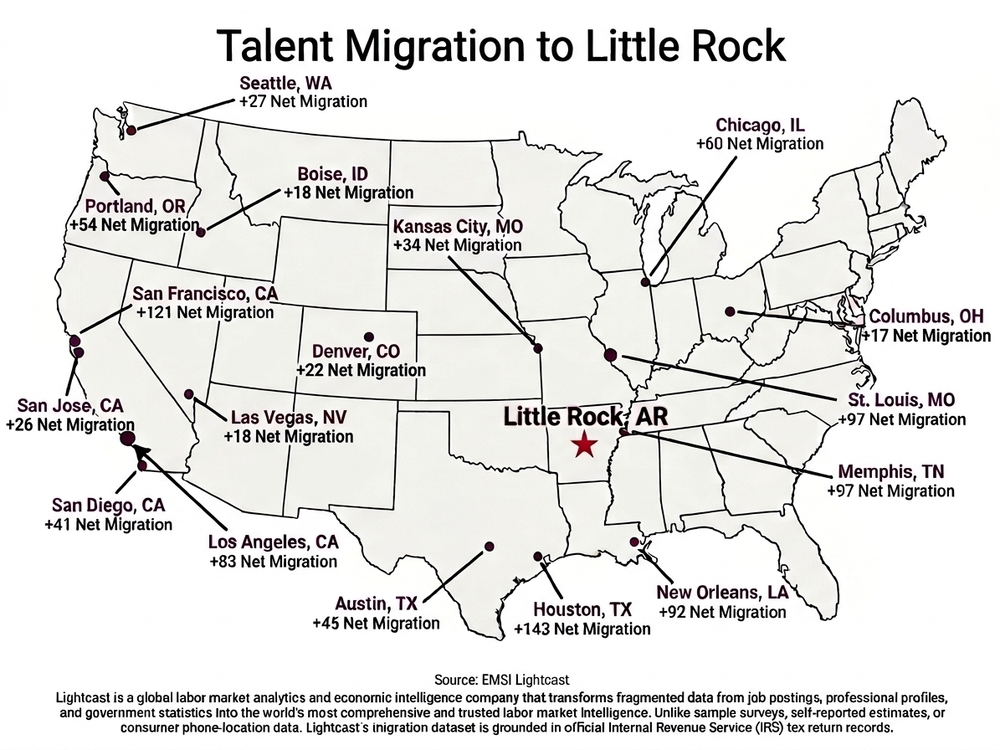
This was the question I set out to answer with the goal of better understanding migration patterns and the balance between our natural population growth and growth driven by migration. Data from Lightcast, tracked directly through official IRS taxpayer relocation filings, shows that more working professionals are moving to the Little Rock metro from major cities across the nation than the other way around. Here’s a snapshot of where people are moving from in the most recent annual filings:
● Phoenix, AZ: +178 Net Migration (257 inbound vs. 79 outbound)
● St. Louis, MO: +146 Net Migration (357 inbound vs. 211 outbound)
● Houston, TX: +143 Net Migration (534 inbound vs. 391 outbound)
● San Francisco, CA: +121 Net Migration (164 inbound vs. 43 outbound)
● Memphis, TN: +97 Net Migration (480 inbound vs. 383 outbound)
● New Orleans, LA: +92 Net Migration (170 inbound vs. 78 outbound)
● Los Angeles, CA: +83 Net Migration (175 inbound vs. 92 outbound)
● Chicago, IL: +60 Net Migration (193 inbound vs. 133 outbound)
● Austin, TX: +45 Net Migration (172 inbound vs. 127 outbound)
● San Diego, CA: +41 Net Migration (106 inbound vs. 65 outbound)
● Kansas City, MO: +34 Net Migration (225 inbound vs. 191 outbound)
● Seattle, WA: +27 Net Migration (101 inbound vs. 74 outbound)
● 383 cities exported talent to Little Rock. Those that exported 20 or more people are included at the bottom of this report.
As of 2025 the Little Rock region's population has increased by 3.3% since 2020, growing by 24,379. Population is expected to increase by 2.6% between 2025 and 2030, adding 20,458. From 2020 to 2025, jobs increased by 9.5% in Little Rock-North Little Rock-Conway, AR from 369,754 to 404,897. As the number of jobs increased, the labor force participation rate increased from 60.6% to 64.5% between 2020 and 2025.
Full List of Cities — Net Migration of 20 people or more:
MSA | Inbound Migrations | Outbound Migrations | Net Migrations |
Phoenix-Mesa-Chandler, AZ | 257 | 79 | 178 |
St. Louis, MO-IL | 357 | 211 | 146 |
Houston-Pasadena-The Woodlands, TX | 534 | 391 | 143 |
San Francisco-Oakland-Fremont, CA | 164 | 43 | 121 |
Memphis, TN-MS-AR | 480 | 383 | 97 |
New Orleans-Metairie, LA | 170 | 78 | 92 |
Los Angeles-Long Beach-Anaheim, CA | 175 | 92 | 83 |
Jonesboro, AR | 405 | 326 | 79 |
Riverside-San Bernardino-Ontario, CA | 162 | 85 | 78 |
Jackson, MS | 121 | 48 | 72 |
Shreveport-Bossier City, LA | 145 | 74 | 71 |
Russellville, AR | 455 | 385 | 70 |
Chicago-Naperville-Elgin, IL-IN | 193 | 133 | 60 |
Longview, TX | 73 | 14 | 58 |
Portland-Vancouver-Hillsboro, OR-WA | 87 | 33 | 54 |
Killeen-Temple, TX | 128 | 82 | 47 |
Austin-Round Rock-San Marcos, TX | 172 | 127 | 45 |
Lawton, OK | 87 | 44 | 43 |
Corpus Christi, TX | 55 | 13 | 42 |
San Diego-Chula Vista-Carlsbad, CA | 106 | 65 | 41 |
Fort Leonard Wood, MO | 43 | 4 | 39 |
Sacramento-Roseville-Folsom, CA | 83 | 46 | 37 |
El Paso, TX | 78 | 42 | 36 |
Kansas City, MO-KS | 225 | 191 | 34 |
San Angelo, TX | 37 | 3 | 34 |
Prescott Valley-Prescott, AZ | 32 | 0 | 32 |
Sherman-Denison, TX | 41 | 9 | 32 |
Bremerton-Silverdale-Port Orchard, WA | 30 | 0 | 30 |
Lake Charles, LA | 57 | 28 | 29 |
Minneapolis-St. Paul-Bloomington, MN-WI | 67 | 39 | 29 |
Stockton-Lodi, CA | 40 | 13 | 27 |
Seattle-Tacoma-Bellevue, WA | 101 | 74 | 27 |
Oxnard-Thousand Oaks-Ventura, CA | 40 | 13 | 27 |
Baton Rouge, LA | 97 | 70 | 27 |
Hattiesburg, MS | 34 | 8 | 26 |
San Jose-Sunnyvale-Santa Clara, CA | 49 | 23 | 26 |
Salinas, CA | 30 | 5 | 26 |
Colorado Springs, CO | 103 | 79 | 24 |
Waco, TX | 49 | 26 | 23 |
Manhattan, KS | 34 | 12 | 23 |
Chattanooga, TN-GA | 40 | 17 | 23 |
Denver-Aurora-Centennial, CO | 199 | 178 | 22 |
Rexburg, ID | 28 | 6 | 22 |
Mount Pleasant, TX | 22 | 1 | 21 |
College Station-Bryan, TX | 38 | 17 | 21 |
Mountain Home, ID | 23 | 3 | 20 |
Ogden, UT | 31 | 11 | 20 |
About the Source:
Lightcast is a global labor market analytics and economic intelligence company that transforms fragmented data from job postings, professional profiles, and government statistics into the world's most comprehensive and trusted labor market intelligence. Unlike sample surveys, self-reported estimates, or consumer phone-location data, Lightcast’s migration dataset is grounded in official Internal Revenue Service (IRS) tax return records. By tracking individual tax filers' address changes year-over-year, it captures actual, verified residential relocations. Because tax filing is tied directly to earned income, this data serves as a filter for working-age professionals, earners, and active members of the labor force. It bypasses temporary population shifts, such as seasonal tourists or short-term visitors, to deliver a clear signal on true workforce talent migration. Rather than looking only at state-level moves, Lightcast maps movement between specific Metropolitan Statistical Areas (MSAs). This allows regional economic developers to pinpoint precisely which metros are supplying talent and which are competing for it. Lightcast data covers 165 countries, representing markets that make up 99% of the world's GDP.